


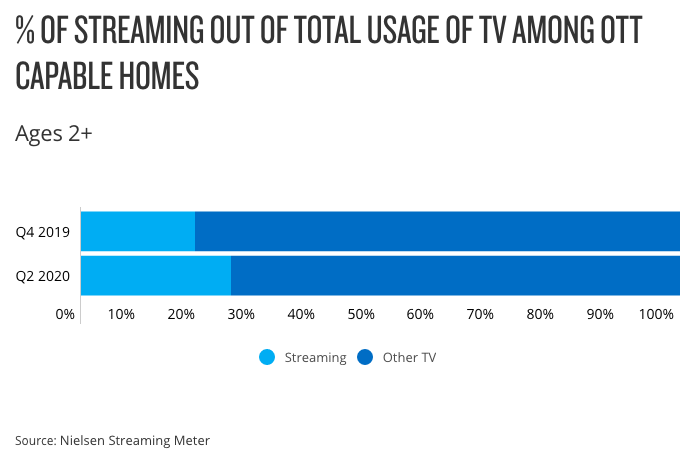
Streaming services now represent 25% of all US TV-viewing minutes, according to new data pulled by Nielsen.
According to its Streaming Meter, a panel of almost 1,000 streaming-capable US homes, streaming’s Q2 2020 share is up from the 19% it represented in Q4 2019.
In all, average weekly streaming minutes are up from 81.7 billion in Q2 2019 to 142.5 billion in Q2 2020, representing a 74% increase.
Q2 comprises the April-to-June period and, therefore, the COVID-19 pandemic, during which lockdowns and stay-at-home measures have driven new media consumption behaviors.
The Mouse marches on
The report shows that Disney+ has already garnered a 4% share of total streaming time – by implication, giving it 0.1% of total TV time.
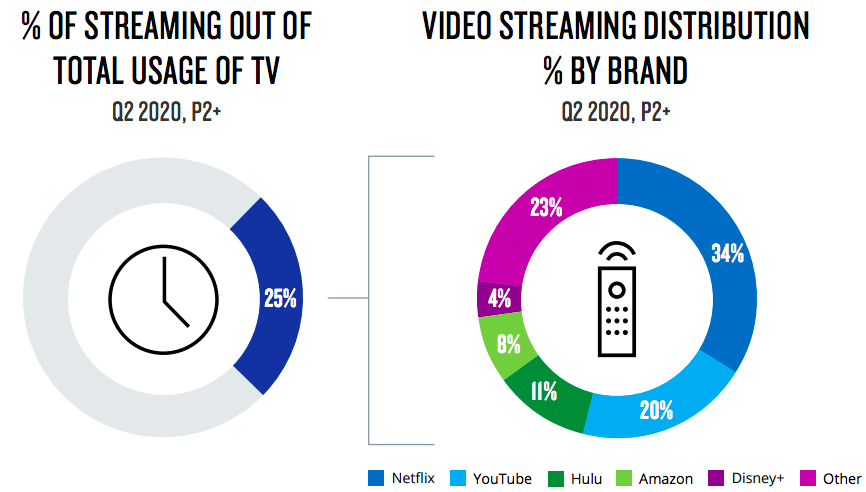
“Disney+ is a newcomer to the arena,” says Peter Katsingris, Nielsen SVP of audience insights, in this video interview with Beet.TV. “For a service that is just starting out, not out there that long, to have 4% is pretty impressive.”
The pack is led by Netflix, followed by YouTube.
Elder viewers switch on
Some of the streaming growth is being driven by increasing comfort of elder viewers with the options available. The majority of streaming time is from those over 35, and those over 55 are now almost the largest category.
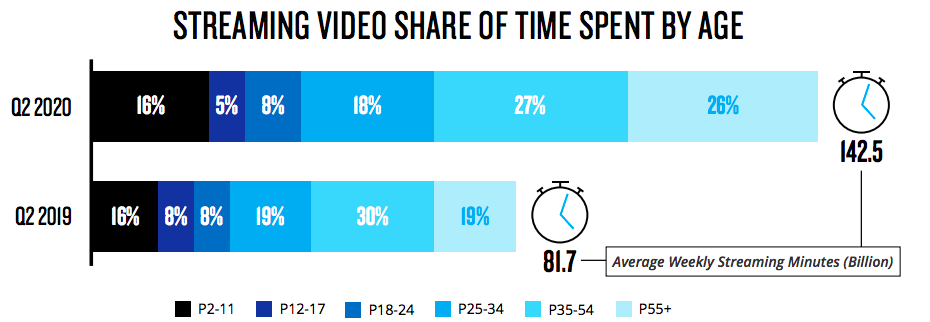
“Over a quarter of the share of TV streaming is done by the older demographic,” says Nielsen’s Katsingris. “Maybe they are slower to the game but, as they had more time to spend at home, perhaps time with loved ones … with a little help, a little guidance, it’s something that they’re embracing now.”
Subscription fatigue has not set in
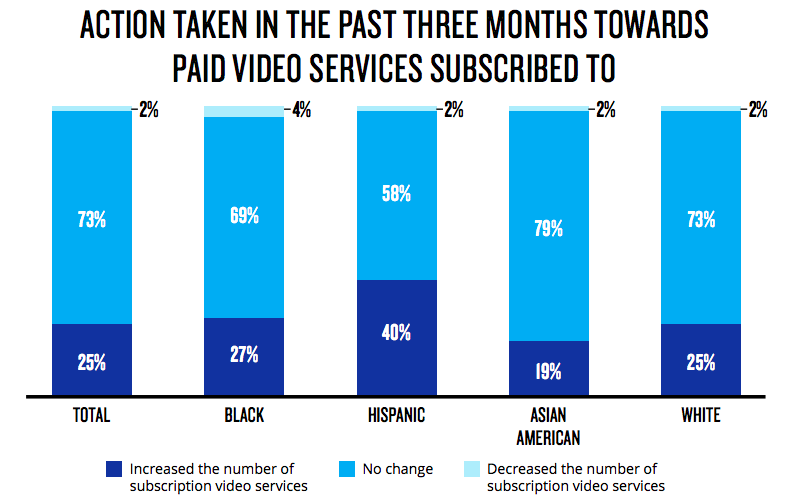
The growing number of streaming services is proving a draw for consumers. Churn out of streaming overall is tiny, at just 2%. Whilst the majority of viewers did not vary their subscription mix, 25% recently added another service, with Hispanics even more likely to have done so.
Mobile is driving media time
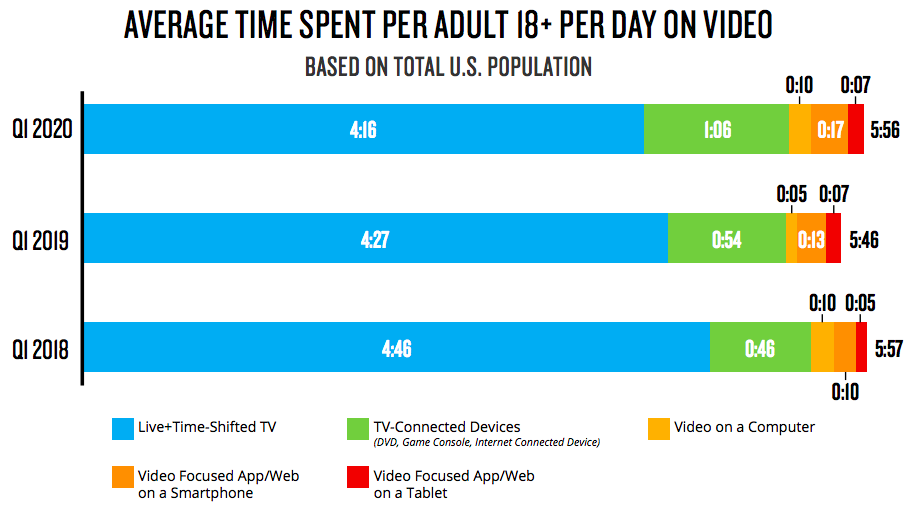
At the macro level, the big story is mobile. Average daily media time is up from 11 hours 27 minutes in Q1 2019 to 12 hours 21 minutes in Q1 2020, which mostly does not factor in the pandemic.
But that is driven substantially by an increase in mobile app or web usage, which now now overtaken minutes spent with live TV in the first quarter for the first time.
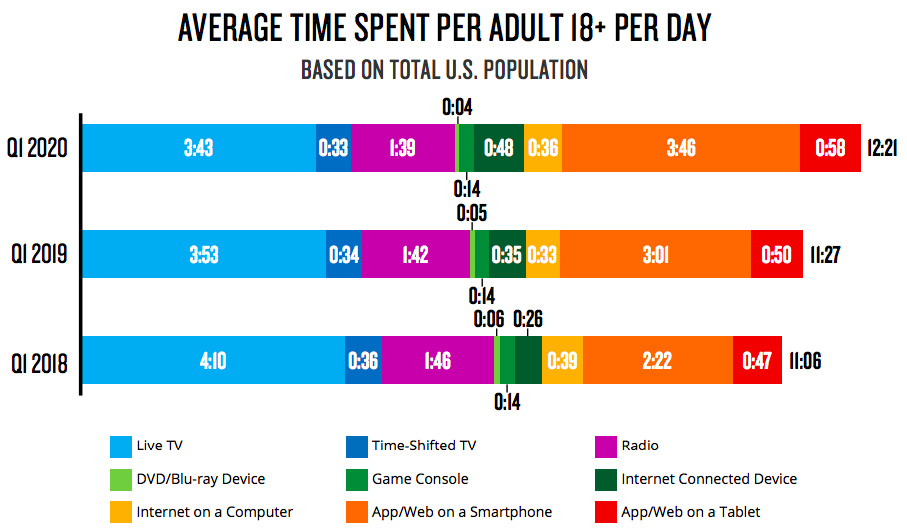
TV is flat but changing
Daily time spent with video is actually down on 2018 levels. Within the average 5 hours and 56 minutes, viewing via connected TVs, computers, smartphones and tablets is displacing that via live and time-shifted TV sets.